![]()
The goal of this powerful package is to provide all necessary tools for analyses of clinical significance in clinical intervention studies. In contrast to statistical significance, which assesses if it is probable that there is a treatment effect, clinical significance can be used to determine if a treatment effect is of practical use or meaningful for patients. This package is designed to help researchers and healthcare professionals determine the clinical relevance of their findings. It provides various functions and tools for quantifying and visualizing clinical significance, making it easier to make informed decisions in the medical field.
Installation
You can install the clinicalsignificance package from CRAN using the following command:
install.packages("clinicalsignificance")Alternatively, you can install the development version from GitHub:
devtools::install_github("pedscience/clinicalsignificance")Main Functions
The main functions of the package are based on the main approaches for clinical significance analyses, i.e., the anchor-based approach, the percentage-change approach, the distribution-based approach, the statistical, and combined approaches. Hence, the main functions are
See the package vignettes for additional details on the various clinical significance approaches.
Example
Claus et al. (2020) implemented a novel intervention to enhance the effectiveness of antidepressants by boosting the inherent placebo effect of that medication. The randomized patients to treatment as usual (TAU) and a placebo amplification (PA) group and measured the severity of depressive symptoms over time.
In the anchor-based approach, a clinical significant change is believed to have occured if a given change is greater or equal to the minimally important difference of the used instrument. Given a tidy dataset of the study and a minimally important difference for the Beck Depression Inventory (second edition, BDI-II) of 7 points, the study data by Claus et al. (2020) may be analyzed as follows:
library(clinicalsignificance)

cs_results <- claus_2020 |>
  cs_anchor(
    id = id,
    time = time,
    outcome = bdi,
    pre = 1,
    post = 4,
    mid_improvement = 7
  )

cs_results
#>
#> ── Clinical Significance Results ──
#>
#> Individual anchor-based approach with a 7 point decrease in instrument scores
#> indicating a clinical significant improvement.
#> Category     |  n | Percent
#> ---------------------------
#> Improved     | 25 |  62.50%
#> Unchanged    | 11 |  27.50%
#> Deteriorated |  4 |  10.00%
You can receive a detailed summary of the analysis by
summary(cs_results)
#>
#> ── Clinical Significance Results ──
#>
#> Individual anchor-based analysis of clinical significance with a 7 point
#> decrease in instrument scores (bdi) indicating a clinical significant
#> improvement.
#> There were 43 participants in the whole dataset of which 40 (93%) could be
#> included in the analysis.
#>
#> ── Individual Level Results
#> Category | n | Percent
#> ---------------------------
#> Improved | 25 | 62.50%
#> Unchanged | 11 | 27.50%
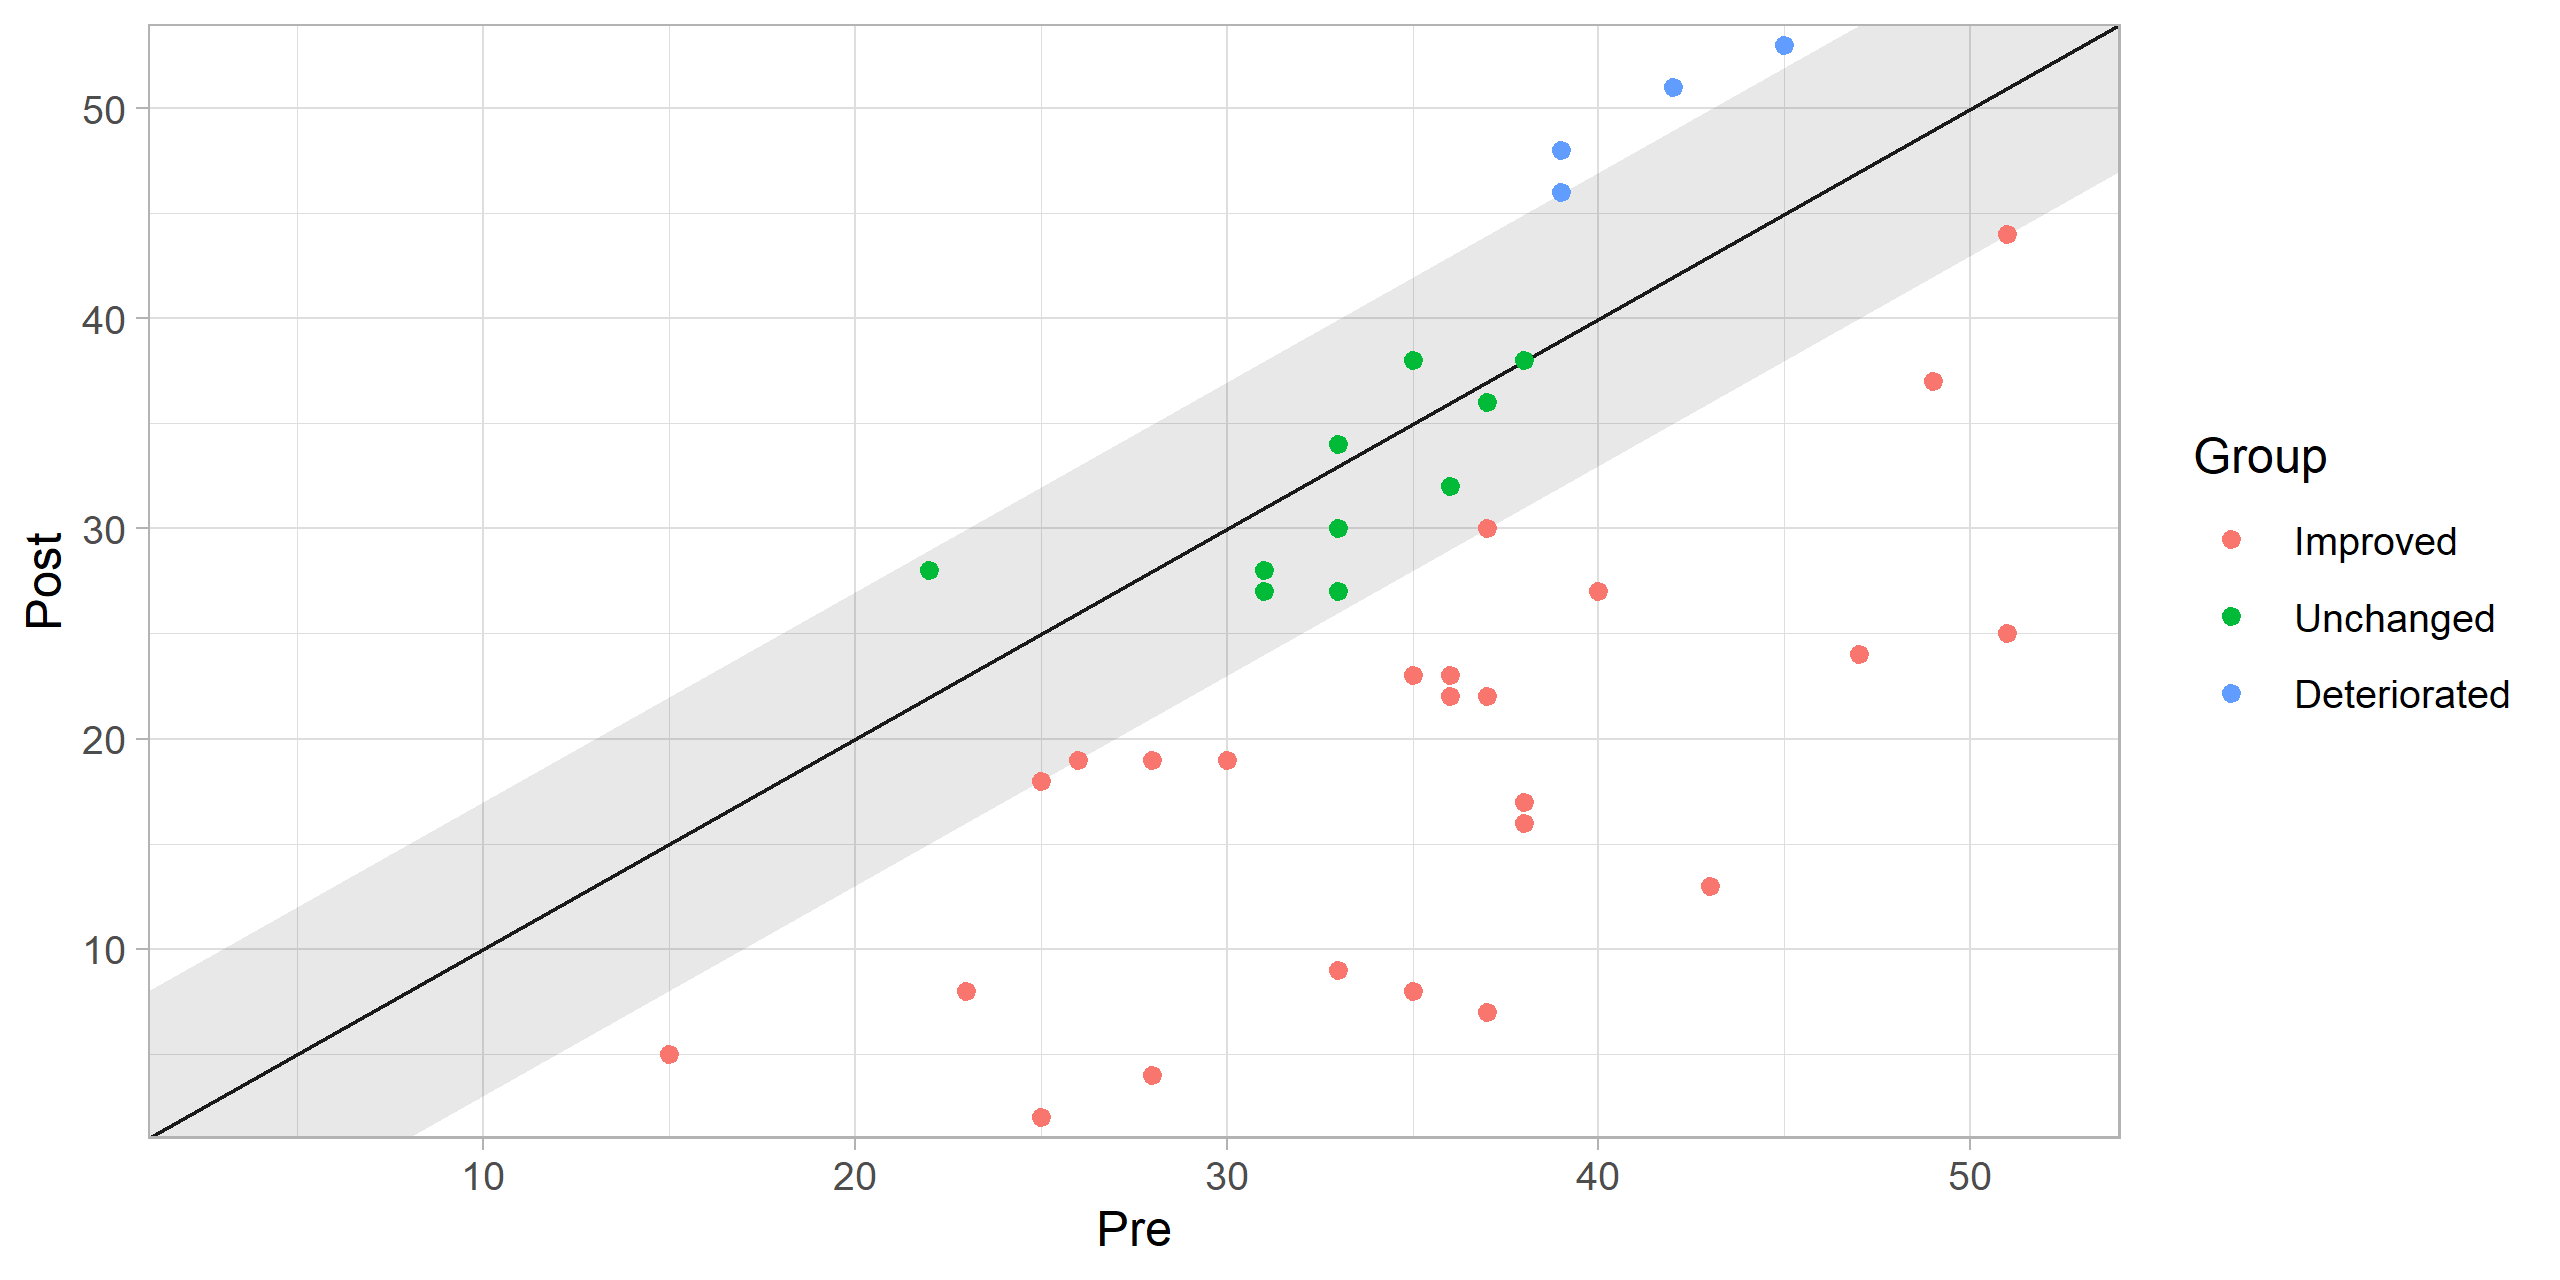
#> Deteriorated | 4 | 10.00%or plot the cs_results with
plot(cs_results)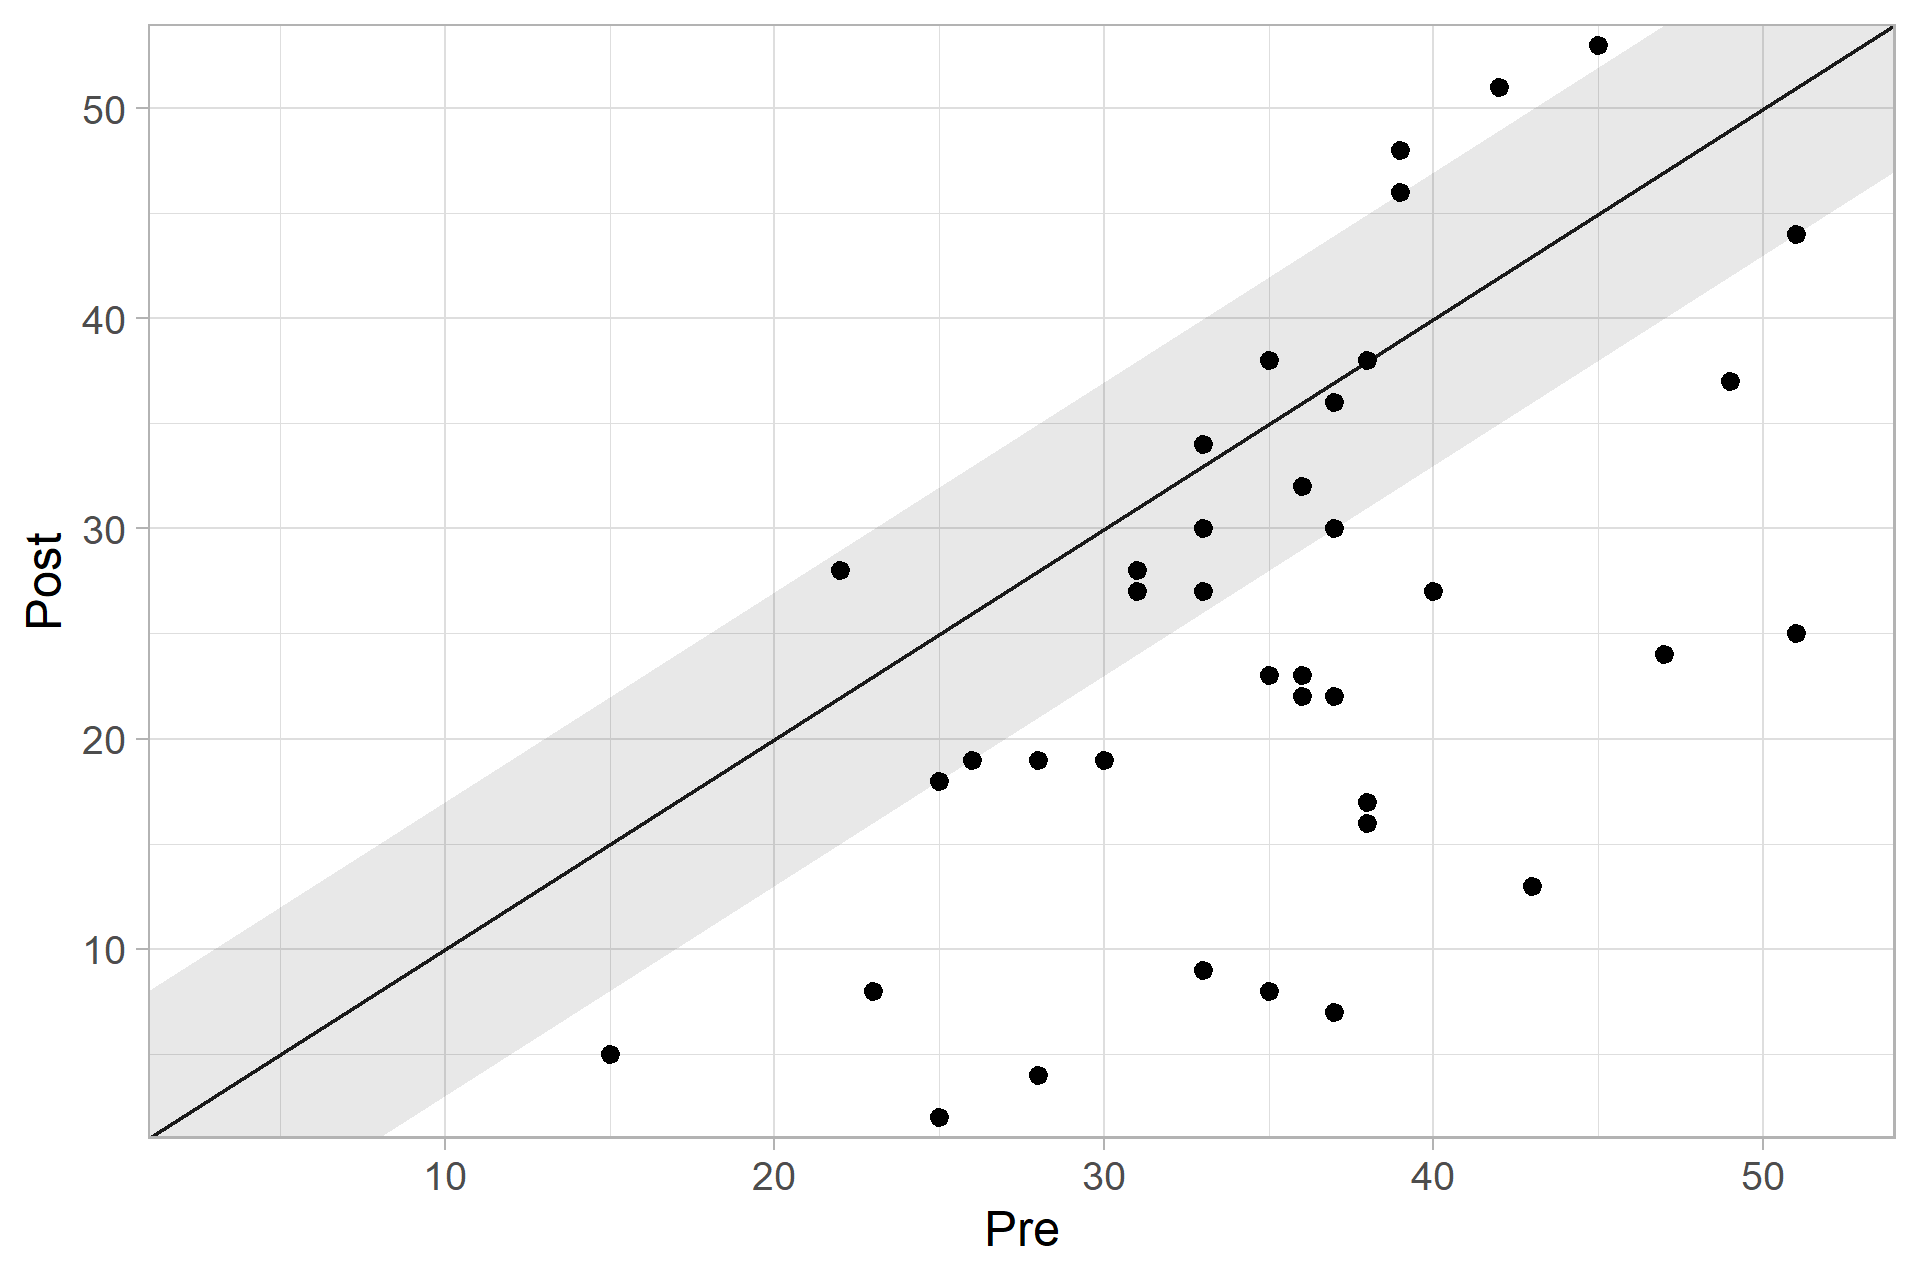
Including Groups
Group-wise results may be obtained by setting the group argument
cs_results_grouped <- claus_2020 |>
  cs_anchor(
    id = id,
    time = time,
    outcome = bdi,
    pre = 1,
    post = 4,
    mid_improvement = 7,
    group = treatment
  )

summary(cs_results_grouped)
#>
#> ── Clinical Significance Results ──
#>
#> Individual anchor-based analysis of clinical significance with a 7 point
#> decrease in instrument scores (bdi) indicating a clinical significant
#> improvement.
#> There were 43 participants in the whole dataset of which 40 (93%) could be
#> included in the analysis.
#>
#> ── Individual Level Results
#> Group |     Category |  n | Percent
#> -----------------------------------
#> TAU   |     Improved |  8 |  20.00%
#> TAU   |    Unchanged |  7 |  17.50%
#> TAU   | Deteriorated |  4 |  10.00%
#> PA    |     Improved | 17 |  42.50%
#> PA    |    Unchanged |  4 |  10.00%
#> PA    | Deteriorated |  0 |   0.00%
plot(cs_results_grouped)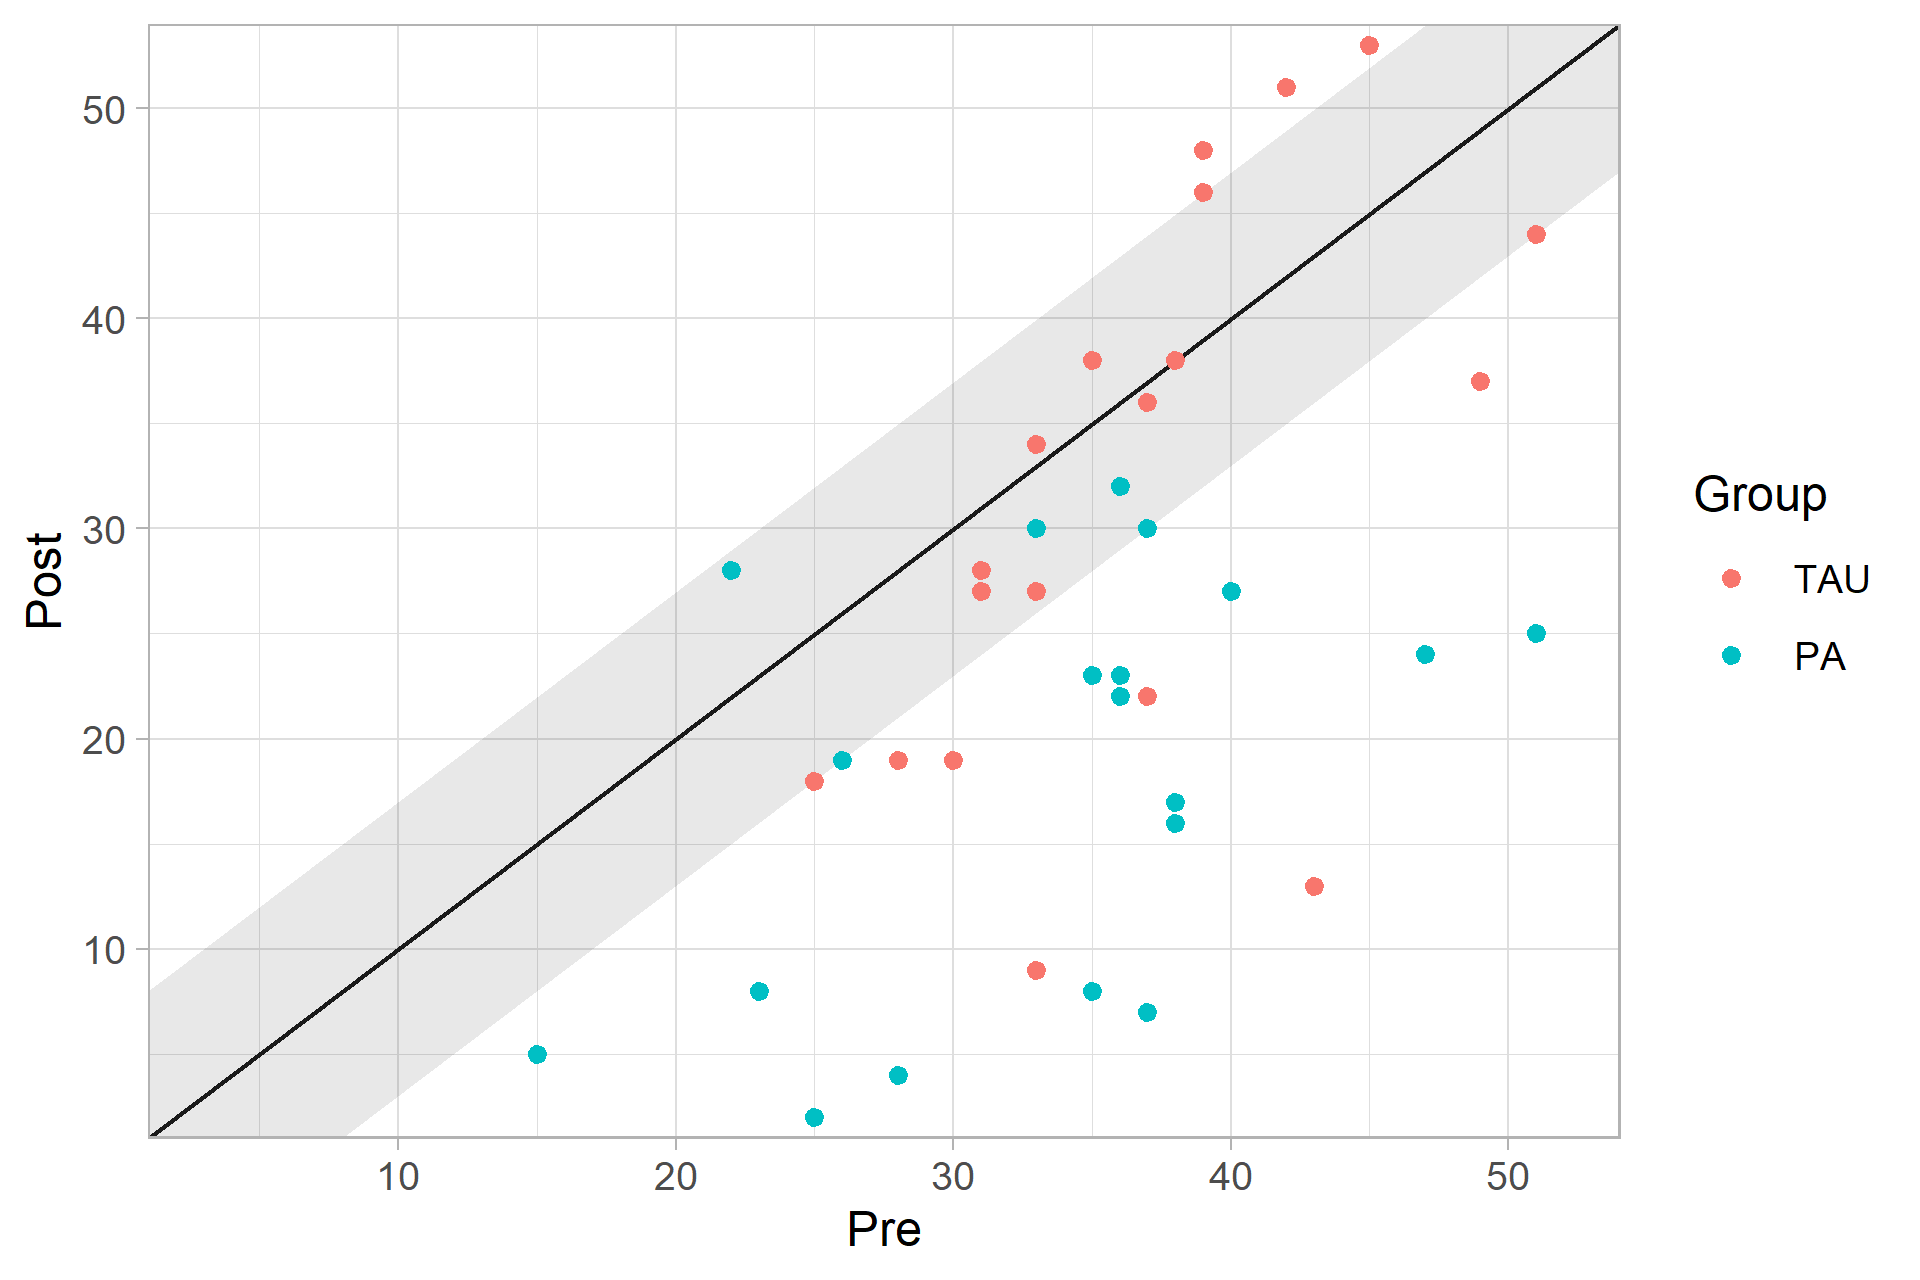
Contributing
We welcome contributions from the R community to enhance the package. If you find any bugs, have feature requests, or would like to contribute improvements, please open an issue or submit a pull request on GitHub.
License
This package is released under the GNU General Public License. You are free to use and distribute it according to the terms of the license.
Thank you for using the clinicalsignificance R package! We hope it proves to be a valuable tool for assessing clinical significance in your medical and healthcare research. If you find it helpful, consider giving us a star on GitHub and spreading the word.