cs_combined() can be used to determine the clinical
significance of intervention studies employing the combination of the
distribution-based and statistical approach. For this, it will be assumed
that the functional (non-clinical population) and patient (clinical
population) scores form two distinct distributions on a continuum.
cs_combined() calculates a cutoff point between these two populations as
well as a reliable change index (RCI) based on a provided instrument
reliability estimate and counts, how many of those patients that showed a
reliable change (that is likely to be not due to measurement error)
switched from the clinical to the functional population during
intervention. Several methods for calculating the cutoff and RCI are
available.
Usage
cs_combined(
  data,
  id,
  time,
  outcome,
  group = NULL,
  pre = NULL,
  post = NULL,
  mid_improvement = NULL,
  mid_deterioration = NULL,
  reliability = NULL,
  reliability_post = NULL,
  m_functional = NULL,
  sd_functional = NULL,
  better_is = c("lower", "higher"),
  rci_method = c("JT", "GLN", "HLL", "EN", "NK", "HA", "HLM"),
  cutoff_type = c("a", "b", "c"),
  significance_level = 0.05
)
Arguments
- data
A tidy data frame
- id
Participant ID
- time
Time variable
- outcome
Outcome variable
- group
Grouping variable (optional)
- pre
Pre measurement (only needed if the time variable contains more than two measurements)
- post
Post measurement (only needed if the time variable contains more than two measurements)
- mid_improvement
Numeric, change that indicates a clinically significant improvement
- mid_deterioration
Numeric, change that indicates a clinically significant deterioration (optional). If
mid_deteriorationis not provided, it will be assumed to be equal tomid_improvement- reliability
The instrument's reliability estimate. If you selected the NK method, the here specified reliability will be the instrument's pre measurement reliability. Not needed for the HLM method.
- reliability_post
The instrument's reliability at post measurement (only needed for the NK method)
- m_functional
Numeric, mean of functional population.
- sd_functional
Numeric, standard deviation of functional population
- better_is
Which direction means a better outcome for the used instrument? Available are
"lower"(lower outcome scores are desirable, the default) and"higher"(higher outcome scores are desirable)
- rci_method
Clinical significance method. Available are
"JT"(Jacobson & Truax, 1991, the default)"GLN"(Gulliksen, Lord, and Novick; Hsu, 1989, Hsu, 1995)"HLL"(Hsu, Linn & Nord; Hsu, 1989)"EN"(Edwards & Nunnally; Speer, 1992)"NK"(Nunnally & Kotsch, 1983), requires a reliability estimate at post measurement. If this is not supplied, reliability and reliability_post are assumed to be equal"HA"(Hageman & Arrindell, 1999)"HLM"(Hierarchical Linear Modeling; Raudenbush & Bryk, 2002), requires at least three measurements per patient
- cutoff_type
Cutoff type. Available are
"a","b", and"c". Defaults to"a"but"c"is usually recommended. For"b"and"c", summary data from a functional population must be given with argumentsm_functionalandsd_functional.- significance_level
Significance level alpha, defaults to
0.05. If you choose the"HA"method, this value corresponds to the maximum risk of misclassification
Categories
Each individual's change can then be categorized into the following groups:
Recovered, i.e., the individual showed a reliable change in the beneficial direction and changed from the clinical to the functional population
Improved, i.e., the individual showed a reliable change in the beneficial direction but did not change populations
Unchanged, i.e., the individual showed no reliable change
Deteriorated, i.e., the individual showed a reliable change in the disadvantageous direction but did not change populations
Harmed, i.e., the individual showed a reliable change in the disadvantageous direction and switched from the functional to the clinincal population
Computational details
There are three available cutoff types, namely a, b, and c which can be used to "draw a line" or separate the functional and clinical population on a continuum. a as a cutoff is defined as the mean of the clinical population minus two times the standard deviation (SD) of the clinical population. b is defined as the mean of the functional population plus also two times the SD of the clinical population. This is true for "negative" outcomes, where a lower instrument score is desirable. For "positive" outcomes, where higher scores are beneficial, a is the mean of the clinical population plus 2 \(\cdot\) SD of the clinical population and b is mean of the functional population minus 2 \(\cdot\) SD of the clinical population. The summary statistics for the clinical population are estimated from the provided data at pre measurement.
c is defined as the midpoint between both populations based on their respective mean and SD. In order to calculate b and c, descriptive statistics for the functional population must be provided.
From the provided data, a region of change is calculated in which an individual change may likely be due to an inherent measurement of the used instrument. This concept is also known as the minimally detectable change (MDC).
Data preparation
The data set must be tidy, which corresponds to a long data frame in general. It must contain a patient identifier which must be unique per patient. Also, a column containing the different measurements and the outcome must be supplied. Each participant-measurement combination must be unique, so for instance, the data must not contain two "After" measurements for the same patient.
Additionally, if the measurement column contains only two values, the first
value based on alphabetical, numerical or factor ordering will be used as
the pre measurement. For instance, if the column contains the
measurements identifiers "pre" and "post" as strings, then "post"
will be sorted before "pre" and thus be used as the "pre" measurement.
The function will throw a warning but generally you may want to explicitly
define the "pre" and "post" measurement with arguments pre and
post. In case of more than two measurement identifiers, you have to
define pre and post manually since the function does not know what your
pre and post intervention measurements are.
If your data is grouped, you can specify the group by referencing the grouping variable (see examples below). The analysis is then run for every group to compare group differences.
See also
Main clinical signficance functions
cs_anchor(),
cs_distribution(),
cs_percentage(),
cs_statistical()
Examples
cs_results <- claus_2020 |>
cs_combined(
id,
time,
bdi,
pre = 1,
post = 4,
reliability = 0.80
)
cs_results
#>
#> ── Clinical Significance Results ──
#>
#> Combined approach using the JT and statistical approach.
#>
#> Category | n | Percent
#> ---------------------------
#> Recovered | 10 | 25.00%
#> Improved | 8 | 20.00%
#> Unchanged | 22 | 55.00%
#> Deteriorated | 0 | 0.00%
#> Harmed | 0 | 0.00%
summary(cs_results)
#>
#> ── Clinical Significance Results ──
#>
#> Combined analysis of clinical significance using the JT and statistical
#> approach method for calculating the RCI and population cutoffs.
#>
#> There were 43 participants in the whole dataset of which 40 (93%) could be
#> included in the analysis.
#>
#> The outcome was bdi and the reliability was set to 0.8.
#>
#> The cutoff type was a with a value of 19.16 based on the following sumamry
#> statistics:
#>
#>
#> ── Population Characteristics
#> M Clinical | SD Clinical | M Functional | SD Functional
#> -------------------------------------------------------
#> 35.48 | 8.16 | --- | ---
#>
#>
#> ── Individual Level Results
#> Category | n | Percent
#> ---------------------------
#> Recovered | 10 | 25.00%
#> Improved | 8 | 20.00%
#> Unchanged | 22 | 55.00%
#> Deteriorated | 0 | 0.00%
#> Harmed | 0 | 0.00%
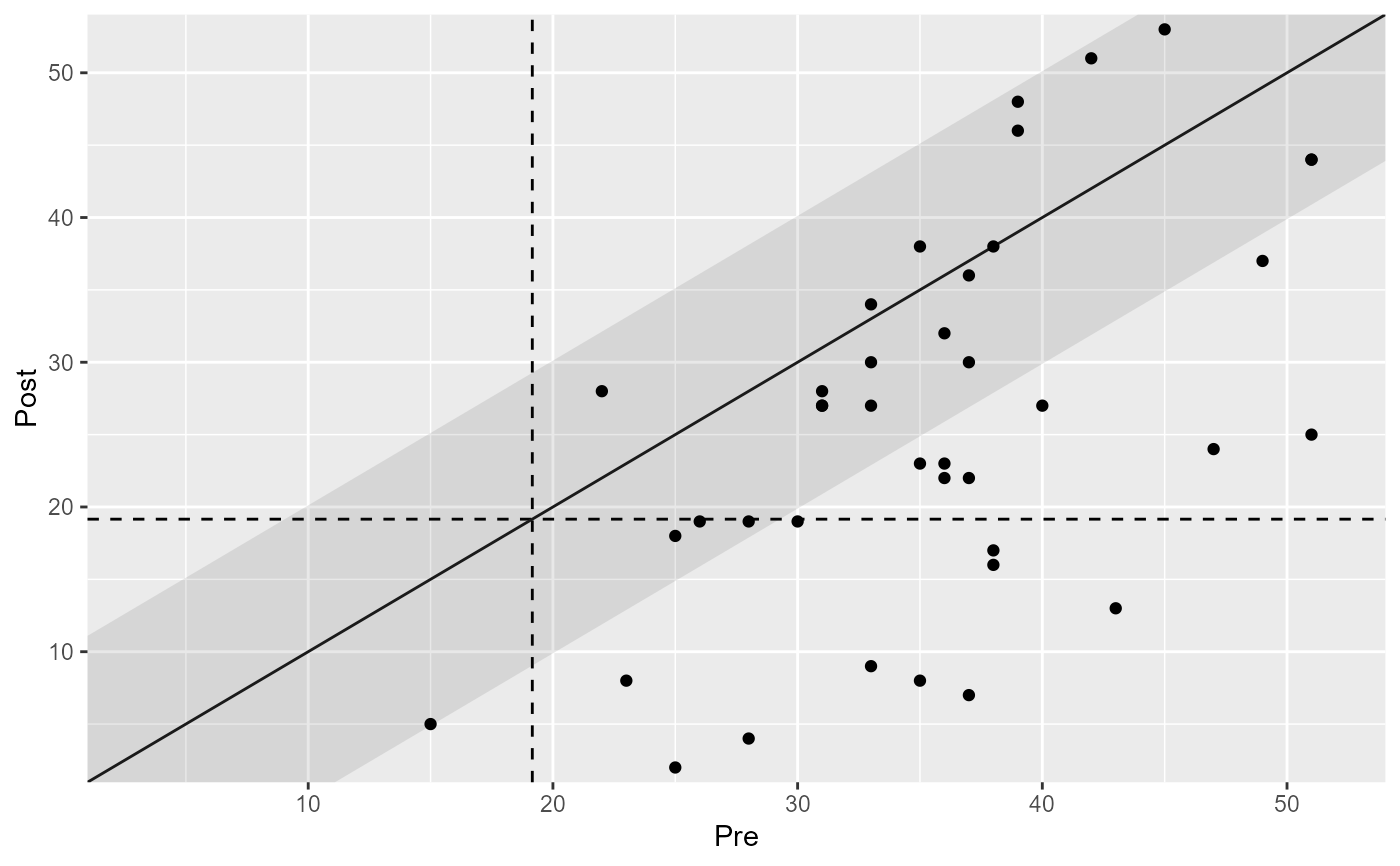
plot(cs_results)
 # You can choose a different cutoff but must provide summary statistics for the
# functional population
cs_results_c <- claus_2020 |>
cs_combined(
id,
time,
bdi,
pre = 1,
post = 4,
reliability = 0.80,
m_functional = 8,
sd_functional = 8,
cutoff_type = "c"
)
cs_results_c
#>
#> ── Clinical Significance Results ──
#>
#> Combined approach using the JT and statistical approach.
#>
#> Category | n | Percent
#> ---------------------------
#> Recovered | 10 | 25.00%
#> Improved | 8 | 20.00%
#> Unchanged | 22 | 55.00%
#> Deteriorated | 0 | 0.00%
#> Harmed | 0 | 0.00%
summary(cs_results_c)
#>
#> ── Clinical Significance Results ──
#>
#> Combined analysis of clinical significance using the JT and statistical
#> approach method for calculating the RCI and population cutoffs.
#>
#> There were 43 participants in the whole dataset of which 40 (93%) could be
#> included in the analysis.
#>
#> The outcome was bdi and the reliability was set to 0.8.
#>
#> The cutoff type was c with a value of 21.6 based on the following sumamry
#> statistics:
#>
#>
#> ── Population Characteristics
#> M Clinical | SD Clinical | M Functional | SD Functional
#> -------------------------------------------------------
#> 35.48 | 8.16 | 8 | 8
#>
#>
#> ── Individual Level Results
#> Category | n | Percent
#> ---------------------------
#> Recovered | 10 | 25.00%
#> Improved | 8 | 20.00%
#> Unchanged | 22 | 55.00%
#> Deteriorated | 0 | 0.00%
#> Harmed | 0 | 0.00%
plot(cs_results_c)
# You can choose a different cutoff but must provide summary statistics for the
# functional population
cs_results_c <- claus_2020 |>
cs_combined(
id,
time,
bdi,
pre = 1,
post = 4,
reliability = 0.80,
m_functional = 8,
sd_functional = 8,
cutoff_type = "c"
)
cs_results_c
#>
#> ── Clinical Significance Results ──
#>
#> Combined approach using the JT and statistical approach.
#>
#> Category | n | Percent
#> ---------------------------
#> Recovered | 10 | 25.00%
#> Improved | 8 | 20.00%
#> Unchanged | 22 | 55.00%
#> Deteriorated | 0 | 0.00%
#> Harmed | 0 | 0.00%
summary(cs_results_c)
#>
#> ── Clinical Significance Results ──
#>
#> Combined analysis of clinical significance using the JT and statistical
#> approach method for calculating the RCI and population cutoffs.
#>
#> There were 43 participants in the whole dataset of which 40 (93%) could be
#> included in the analysis.
#>
#> The outcome was bdi and the reliability was set to 0.8.
#>
#> The cutoff type was c with a value of 21.6 based on the following sumamry
#> statistics:
#>
#>
#> ── Population Characteristics
#> M Clinical | SD Clinical | M Functional | SD Functional
#> -------------------------------------------------------
#> 35.48 | 8.16 | 8 | 8
#>
#>
#> ── Individual Level Results
#> Category | n | Percent
#> ---------------------------
#> Recovered | 10 | 25.00%
#> Improved | 8 | 20.00%
#> Unchanged | 22 | 55.00%
#> Deteriorated | 0 | 0.00%
#> Harmed | 0 | 0.00%
plot(cs_results_c)
 # You can group the analysis by providing a grouping variable in the data
cs_results_grouped <- claus_2020 |>
cs_combined(
id,
time,
bdi,
pre = 1,
post = 4,
group = treatment,
reliability = 0.80,
m_functional = 8,
sd_functional = 8,
cutoff_type = "c"
)
cs_results_grouped
#>
#> ── Clinical Significance Results ──
#>
#> Combined approach using the JT and statistical approach.
#>
#> Group | Category | n | Percent
#> -----------------------------------
#> TAU | Recovered | 3 | 7.50%
#> TAU | Improved | 2 | 5.00%
#> TAU | Unchanged | 14 | 35.00%
#> TAU | Deteriorated | 0 | 0.00%
#> TAU | Harmed | 0 | 0.00%
#> PA | Recovered | 7 | 17.50%
#> PA | Improved | 6 | 15.00%
#> PA | Unchanged | 8 | 20.00%
#> PA | Deteriorated | 0 | 0.00%
#> PA | Harmed | 0 | 0.00%
summary(cs_results_grouped)
#>
#> ── Clinical Significance Results ──
#>
#> Combined analysis of clinical significance using the JT and statistical
#> approach method for calculating the RCI and population cutoffs.
#>
#> There were 43 participants in the whole dataset of which 40 (93%) could be
#> included in the analysis.
#>
#> The outcome was bdi and the reliability was set to 0.8.
#>
#> The cutoff type was c with a value of 21.6 based on the following sumamry
#> statistics:
#>
#>
#> ── Population Characteristics
#> M Clinical | SD Clinical | M Functional | SD Functional
#> -------------------------------------------------------
#> 35.48 | 8.16 | 8 | 8
#>
#>
#> ── Individual Level Results
#> Group | Category | n | Percent
#> -----------------------------------
#> TAU | Recovered | 3 | 7.50%
#> TAU | Improved | 2 | 5.00%
#> TAU | Unchanged | 14 | 35.00%
#> TAU | Deteriorated | 0 | 0.00%
#> TAU | Harmed | 0 | 0.00%
#> PA | Recovered | 7 | 17.50%
#> PA | Improved | 6 | 15.00%
#> PA | Unchanged | 8 | 20.00%
#> PA | Deteriorated | 0 | 0.00%
#> PA | Harmed | 0 | 0.00%
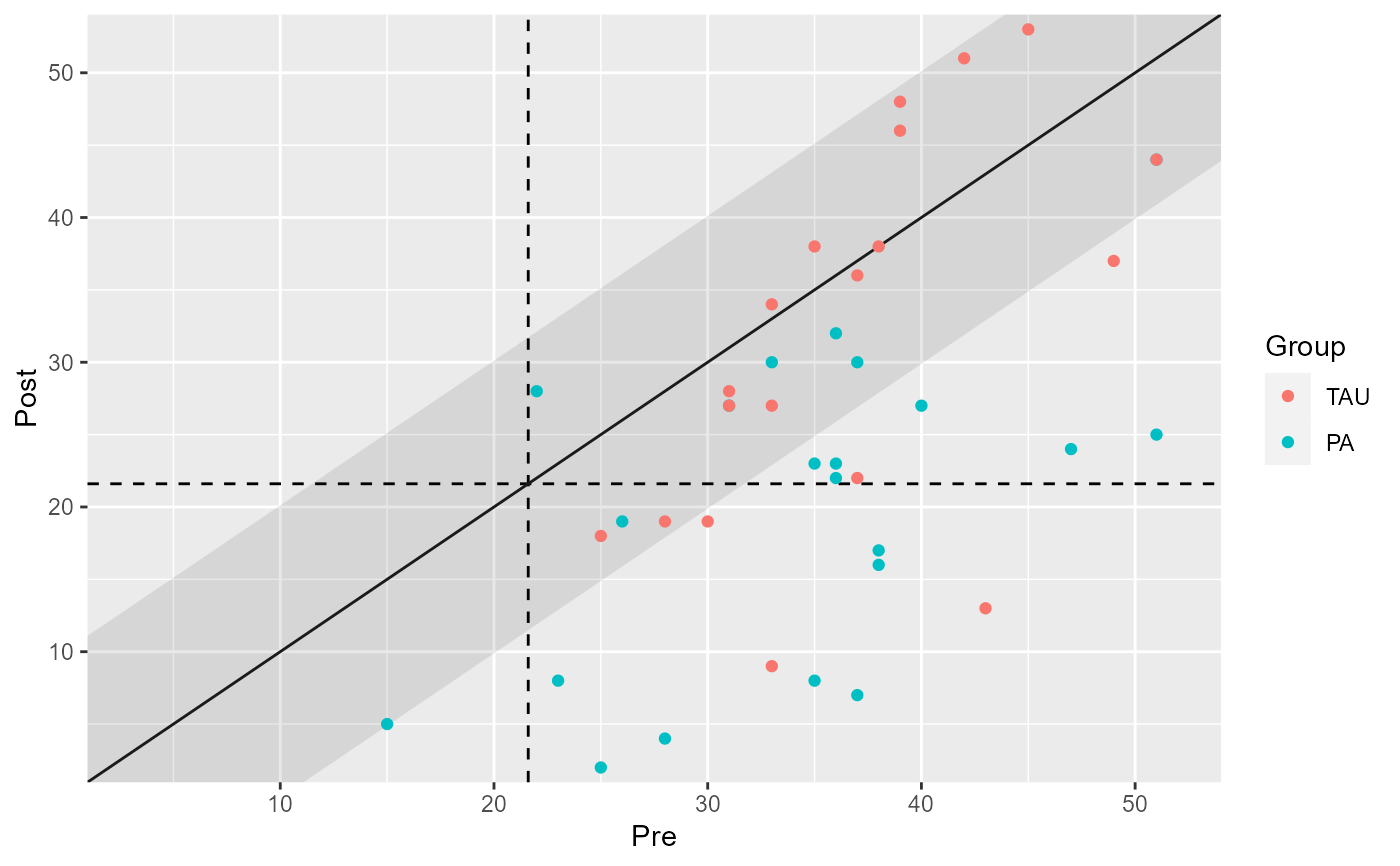
plot(cs_results_grouped)
# You can group the analysis by providing a grouping variable in the data
cs_results_grouped <- claus_2020 |>
cs_combined(
id,
time,
bdi,
pre = 1,
post = 4,
group = treatment,
reliability = 0.80,
m_functional = 8,
sd_functional = 8,
cutoff_type = "c"
)
cs_results_grouped
#>
#> ── Clinical Significance Results ──
#>
#> Combined approach using the JT and statistical approach.
#>
#> Group | Category | n | Percent
#> -----------------------------------
#> TAU | Recovered | 3 | 7.50%
#> TAU | Improved | 2 | 5.00%
#> TAU | Unchanged | 14 | 35.00%
#> TAU | Deteriorated | 0 | 0.00%
#> TAU | Harmed | 0 | 0.00%
#> PA | Recovered | 7 | 17.50%
#> PA | Improved | 6 | 15.00%
#> PA | Unchanged | 8 | 20.00%
#> PA | Deteriorated | 0 | 0.00%
#> PA | Harmed | 0 | 0.00%
summary(cs_results_grouped)
#>
#> ── Clinical Significance Results ──
#>
#> Combined analysis of clinical significance using the JT and statistical
#> approach method for calculating the RCI and population cutoffs.
#>
#> There were 43 participants in the whole dataset of which 40 (93%) could be
#> included in the analysis.
#>
#> The outcome was bdi and the reliability was set to 0.8.
#>
#> The cutoff type was c with a value of 21.6 based on the following sumamry
#> statistics:
#>
#>
#> ── Population Characteristics
#> M Clinical | SD Clinical | M Functional | SD Functional
#> -------------------------------------------------------
#> 35.48 | 8.16 | 8 | 8
#>
#>
#> ── Individual Level Results
#> Group | Category | n | Percent
#> -----------------------------------
#> TAU | Recovered | 3 | 7.50%
#> TAU | Improved | 2 | 5.00%
#> TAU | Unchanged | 14 | 35.00%
#> TAU | Deteriorated | 0 | 0.00%
#> TAU | Harmed | 0 | 0.00%
#> PA | Recovered | 7 | 17.50%
#> PA | Improved | 6 | 15.00%
#> PA | Unchanged | 8 | 20.00%
#> PA | Deteriorated | 0 | 0.00%
#> PA | Harmed | 0 | 0.00%
plot(cs_results_grouped)